One of the Commission’s key concerns about child poverty is its growth of poverty in working families – a trend both recent and startling.
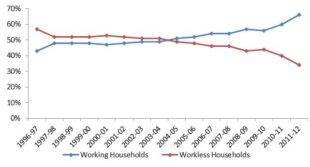
As our State of the Nation report highlighted, in 1996-97, more children in poverty lived in workless households than in working households. By 2011-12, this position had turned on its head, with twice as many children in working poor households than in workless households.1
If families where there is child poverty had a typical face it would now be low-paid cleaners, shop assistants or security guards, not those on out-of-work benefits.
Proportion of children in poverty in working and working households
But dig beneath the surface and the story is more complicated than it first appears. The change has been driven by three things, two of which are good news:
- A big decrease in the proportion of children living in workless households: from 20% in 1996 to 14% in 2013.
- A big reduction in the risk of poverty for children in workless households: from 67% in 1996-97 to 40% in 2011-12.
- Only a small decrease in the risk of poverty for children in working households: overall from 15% in 1996-97 to 13% in 2011-12. (Though, to make things trickier, there was more progress for some groups than others: for example, the risk of poverty among working lone parents decreased from 21% in 1996-97 to 13% in 2011-12 at the same time as there were big increases in the proportion of lone parents who were in work. Whereas for couples with at least one full-time worker poverty risks were stationary or rising since 2005).
Bringing these points together, we see an important truth: the problem facing the UK is less that working poverty has gone up. It is more that its relative importance has increased because of the remarkable fall in workless poverty.
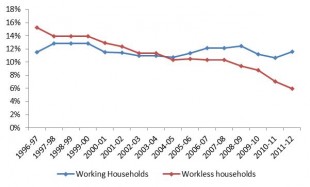
Proportion of all children who are in poverty, by work status of household
This is reflected in the graph above, which shows that the proportion of all children who are in working poor households has remained broadly constant2 – even as the proportion of all children who are in workless poor households has fallen rapidly.
A policy success then – reducing worklessness and protecting children’s living standards when parents are out of work – has exposed a policy failure – protecting children’s living standards when parents are in work.
Why is working poverty so intransigent?
There are three immediate reasons families find themselves in working poverty: they either do not work "enough" hours; or their hourly earnings from work are inadequate; or any earnings shortfall is not made good by transfers from the state in the form of Child Benefit or tax credits. A key question for anti-poverty policy is which of these explanations is most important.
In our State of the Nation report, we found that pay levels have become relatively more important than hours of work - so much so that they are now the stronger predictor of whether or not a child is poor.
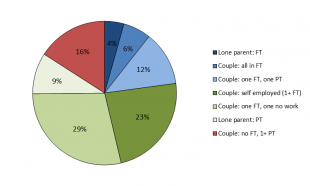
We also found a startling new fact: three quarters of children in working poor households live with at least one adult who is in full-time work.
So the problem is not that there is no one in full-time work but there are far higher risks of poverty among couples where there is only a full-time worker or the prime earner is self-employed. (Here around one in five families are working poor compared to one in 20 where there are two earners).
The government has pointed out in its new child poverty strategy that only around 10% of children in working poor households have all parents working full-time with neither parent in full-time self-employment (i.e. a lone parent or both parents in a couple).
But this doesn’t seem a good measure. Society accepts that there are good reasons why some families should not be expected to have everyone in full-time work: sickness and disability or the need to care for young children. And it is unclear why families with someone who is in self-employment have been excluded from this statistic.
Compositional analysis of children in working poverty
Is there a better way of thinking about ‘working enough’? A good starting point might be the Government’s default expectation on parental employment which it sets out in its Universal Credit guidance. This hasn’t had much attention but is arguably the state’s definition of responsibility in the labour market. When the Prime Minister talks about families “who work hard and do the right thing” this has a very clear meaning within Universal Credit:
- One adult in a couple in full-time work.
- Lone parents, or the second adult in a couple:
- Working full-time if the youngest child is aged 13+.
- Working part-time if the youngest child is aged 5-12.
- Not expected to work if the youngest child is under 5 years old.
People will have their own views on whether or not these expectations are reasonable, especially given the state of the labour market and the requirements of some low-paid jobs for unpredictable hours that can sometimes be difficult to combine with childcare requirements. And it is clear that this default is not the expectation that the state has on some parents given, for example, sickness and disability of them, their children or other family members.
But given these expectations exist, they raise some tantalising questions. What proportion of working poor households are meeting - and not meeting - these conditions? If we knew we could say with much more precision what proportion of the child poverty problem is a consequence of low pay and what is symptomatic of a household working less than society might expect them too.
Frustratingly however, there are no published estimates of this. Time to get modelling it seems.
Despite the data limitations, there is a new clarity in child poverty analysis that one full-time wage is not enough to guarantee escape from poverty. So efforts to tackle child poverty are increasingly going to need to focus on raising wages at the bottom of the pay league, and to increase the numbers of dual earner couples.
Notes:
(1) All data on working poverty cited in this blog post come from Commission analysis of the published estimates within Households Below Average Income 1994/95 to 2011/12 – Department for Work and Pensions (2013). They are rough estimates as they are based on manipulation of rounded data.
(2) All data is based on the official definition of relative poverty – equivalised income of 60% of the median before housing costs. Other definitions of poverty can give a different picture of the rise of working poverty. For example, the proportion of children in absolute working poverty (60% of the 2010/11 median income) after housing costs has risen from 13.9% in 2003/04 to 16.1% in 2007/08 and 18.7% in 2011/12
Postscript:
In response to this blog, Professor Jonathan Bradshaw and Dr Gill Main at the University of York have done some analysis to help answer the question I posed above – what proportion of children in working poor households live with parents who might be expected to work more under Universal Credit?
You can read their full analysis here, but their key conclusions were that:
- 42% of children in working poor households live with adults who might be considered to “have potential to work more hours” under Universal Credit before accounting for adult disabilities or caring responsibilities.
- Assuming that it is reasonable for parents with disabilities or with caring responsibilities for children with disabilities to not work, this would reduce the proportion of children living in a working poor household with adults who might be considered to “have potential to work more hours” to 30%.
Bradshaw and Main caution that this estimate is an approximation, and that further analysis with the Family Resources Survey would enable a more accurate assessment to be made.


1 comment
Comment by Jonathan Bradshaw posted on
I have sent Paul an estimate of the number of working poor with earnings potential